It is essential to learn IELTS Writing Task 1 Line Graph because it is one of the most basic ways to represent data and figures. Line graphs can be used to show how information or data change over time.
How to describe a line graph for IELTS writing task 1?
There will be four different parts in an IELTS Writing Task 1 Line Graph essay:
- Introduction.
- Overview.
- Body:
- It is suggested that the body should be divided into two paragraphs.
- The first body paragraph can illustrate the figures having the same trend (increasing or decreasing) and the other will be the opposite.
- The other way to divide the body is to base on the categories such as countries, genders, etc. In addition, you can split up the body according to the period of time.
Here are some tips to describe a line graph for IELTS writing task 1:
- Have a clear introduction, try to include all information from the two-axis and the names of categories.
- Put all main trends in an overview statement – this should be contained in one paragraph. And do not divide your key points into different paragraphs. Make sure you include the main increases and decreases shown.
- Use a range of vocabulary and do not make spelling mistakes.
- Put numbers or percentages to support your sentences in the body paragraph. Failure to do that will result in a low score.
- Organise your body paragraphs logically so it is easy for the examiner to read. Leave an empty line between paragraphs to make them easier to see. This is not a rule, it is a strong recommendation.
- If the line graph contains many lines and a lot of movement, be selective. You are being marked on your ability to select key features.
- Don’t spend more than 20 mins on task 1. You will need a full 40 mins for task 2.
- Write 150 words or more. Aim for about 160-190 words. Don’t write under the word count.
- Follow well-written model answers.
IELTS Writing Task 1 Line Graph Sample
This IELTS writing line graph sample is based on a band 9 score. The following is a model response for the IELTS writing task 1 academic paper. For any IELTS line graph, use this sample writing as a template for structure, important characteristics, and language.
Tips:
Rewrite this IELTS writing task 1 line graph Sample. Just take 15 -20 minutes to rewrite it. Try to change every sentence structure that wrote in this report with a new structure.
Practice using different structures because in the exam that will help you a lot. You will have a variety, you will have accuracy and make your report well organized. And of course, you will get a high score.
Question
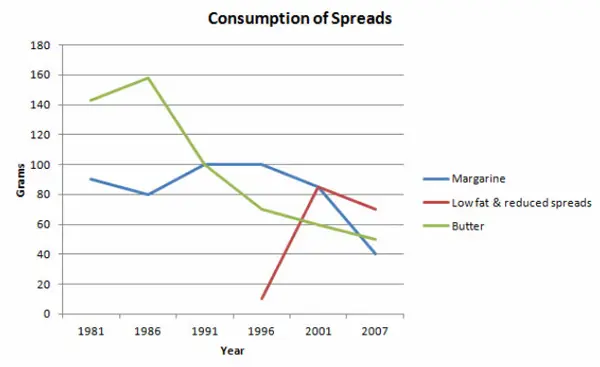
The graph below shows the consumption of 3 spreads from 1981 to 2007.
IELTS Line Graph Answer
The line graph illustrates the amount of three kinds of spreads (margarine, low fat and reduced spreads and butter) which were consumed over 26 years from 1981 to 2007. Units are measured in grams.
Overall, the consumption of margarine and butter decreased over the period given, while for low fat and reduced spreads, it rose. At the start of the period, butter was the most popular spread, which was replaced by margarine from 1991 to 2001, and following that low fat and reduced spreads became the most widely used spread in the final years.
With regards to the amount of butter used, it began at around 140 grams and then peaked at 160 grams in 1986 before falling dramatically to about 50 grams in the last year. Likewise, approximately 90 grams of margarine was eaten in the first year after which the figure fluctuated slightly and dropped to a low of 40 grams in 2007.
On the other hand, the consumption of low fats and reduced spreads only started in 1996 at about 10 grams. This figure, which reached a high of just over 80 grams 5 years later, fell slightly in the final years to approximately 70 grams in 2007.